At the invitation of architect Carlo Ratti, director of MIT’s Senseable City Lab, I was just in Berlin to lead a workshop on “Foodscape Mapping” at the BMW Guggenheim Lab.
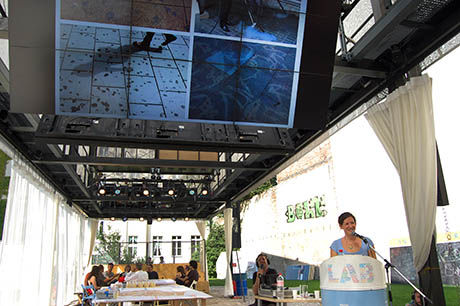
IMAGE: Talking about chewing gum mapping. Photo by Geoff Manaugh.
I pulled together a presentation that included many of my favourite examples of foodscape mapping, using Christopher Stocks’ vegetable gazetteer to discuss the ways in which the things we choose to mark on maps tell us what to look at and value, before moving on to the idea of a map as a spatial diagnostic, enabling food detectives to spot patterns and test correlations.
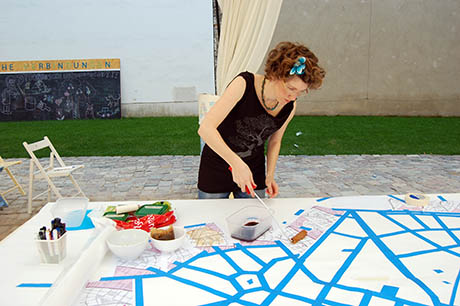
IMAGE: Alex Toland begins to paint the map with coffee.
In addition to revealing the hidden overlaps and trends that suggest opportunities for effective interventions, maps can also make disconnected, distributed parts visible as a substantive whole. My examples here ranged in scale and ambition from Jeff Sisson’s bodega mapping project to Nicholas de Monchaux’s Local Code.
With only a brief diversion into the insights afforded by frequently overlooked spatial data, such as chewing gum deposits, rat infestations, and sewer smells, I ended with a look at the artificial geography of food packaging as a way to emphasise the value of making foodscape maps.
Rather than the comfortable abstractions of pastoral imagery and made-up place names, cartography requires and inspires curiosity — a close examination of the foodscape, prompting questions and requiring decisions about metrics, and perhaps even suggesting opportunities to re-draw the map.
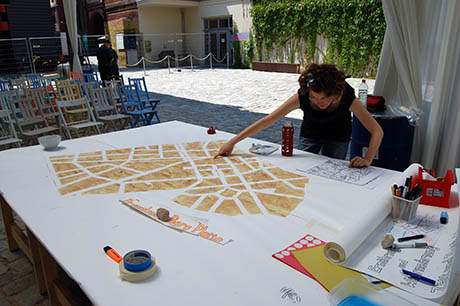
IMAGE: Alex and I preparing the map.
Having made my case, we then made a map! My Berlin-based collaborator, the artist, urban ecologist, and soil expert Alexandra Regan Toland, and I had started work at the crack of dawn to create a coffee-wash street map of Lab’s immediate vicinity, in the fashionable former East German neighbourhoods of Mitte and Prenzlauer Berg.
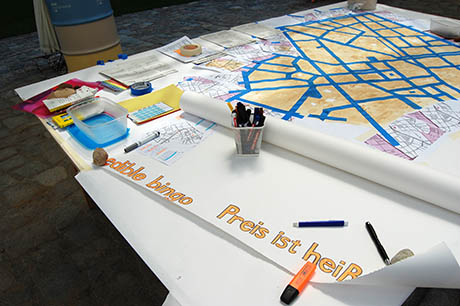
IMAGE: Alex and I preparing the map.
Each of the workshop participants was given a instruction sheet and sent out to gather spatial food data.
Alex and I had had a lot of fun working together over the past few weeks to come up with a variety of challenges tailored to the local foodscape, from “Der Preis ist Heiß,” charting the price geography of such standards as coffee, beer, and brötchen, to the “Prenzlauer Berg Plate,” which mapped the neighborhood according to the dining recommendations of the people we encountered on its streets.
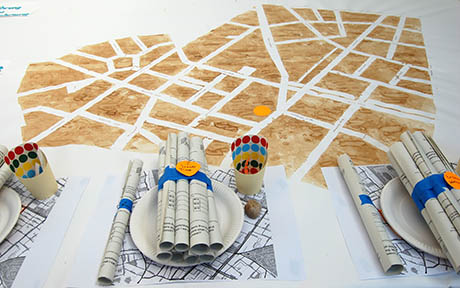
IMAGE: Worksheets, maps, plates, stickers, and to-go cups, all set up ready to map the neighbourhood foodscape. Photo by Geoff Manaugh.
“Edible Bingo” asked participants to collect photographs, edible evidence, and location data for a variety of food landmarks: a food resource for non-humans; a mobile food or drink vendor; a place where food could be grown or scavenged; and food or drink-related litter or waste. Every ten minutes, we asked participants to record where they were and what they could smell.
Finally, each different group received a special assignment, which asked them to map the edible environment according to one of the following themes: nutrition and perception (keeping count of the use of the word “Bio,” for example, or finding the products with the most sugar and fat), according to its place of origin (both for cuisines and groceries), according to its place on the junk-wild gradient, where 1 was ultra-processed and 5 was totally wild, and, finally, according to its place in time, from trends such as bubble tea to former breweries, and from seasonal Werder cherries to late-night convenience shops (spätis).
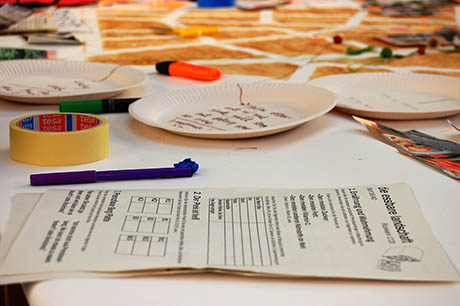
IMAGE: “Die essbare Landscaft” — our worksheets were in English and also, thanks to Alex, German. Photo by Geoff Manaugh.
After a forty-minute safari, we all reassembled at the Guggenheim lab to add our data to the map. Although it was hardly a scientific study, it was fascinating to hear anecdotes, examine the edible evidence, and speculate as to the reasons behind the patterns we noticed.
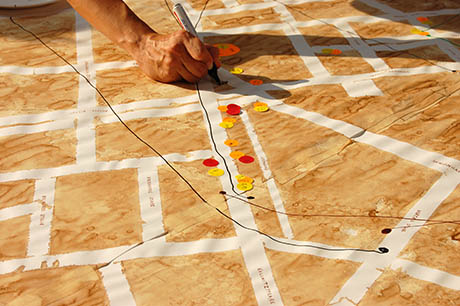
IMAGE: “The Price is Right” or “Der Preis ist Heiß,” mapping coffee, bier, and bread roll prices. Photo by Geoff Manaugh.
As we collated our findings using stickers and felt tips, we hypothesised that variations in the price of coffee could be attributed either to the division between Mitte and Prenzlauer Berg or based on proximity to the U-Bahn versus the Straßenbahn.
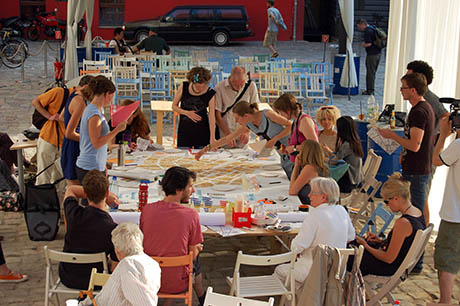
IMAGE: Mapping the edible landscape at the Guggenheim Lab in Berlin.
We noted that dining suggestions from the people who worked in Prenzlauer Berg restaurants and coffee shops were all for places that were elsewhere in Berlin, where they lived, which led us to think of the neighbourhood’s food service professionals as a migratory population, inhabiting Prenzlauer Berg only during popular eating and drinking hours.
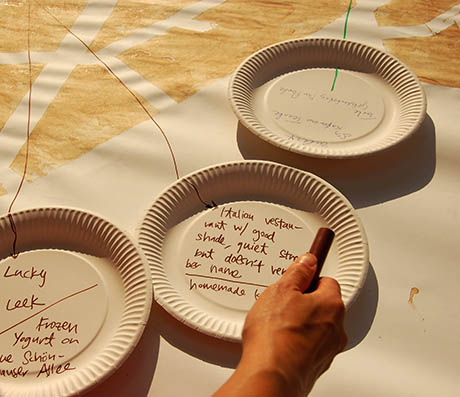
IMAGE: “Prenzlauer Berg Plates” documented local recommendations on where to eat. Photo by Geoff Manaugh.
Vietnamese restaurants quickly emerged as the most common global cuisine, a legacy of socialist bloc trade and training relationships between East Germany and Vietnam. The neighbourhood was also rich in foraging opportunities, with groups finding mushrooms, dandelion leaves, rose hips, lavender, and even marijuana plants, growing freely in the park.
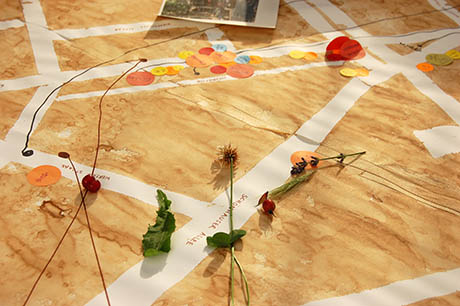
IMAGE: Edible evidence on Schönhauser Allee. Photo by Geoff Manaugh.
Other highlights included a photograph of a giant cow, which spurred some discussion of the large number of ice cream shops in the area (attributed to the preponderance of young families); a lovely advertisement for a vegetable parade, which our enthusiastic participants liked so much that they brought it back with them; and some reflection on the difficulty of collecting brötchen data in the late afternoon (when all the bread rolls have been sold and the bakeries are closed).
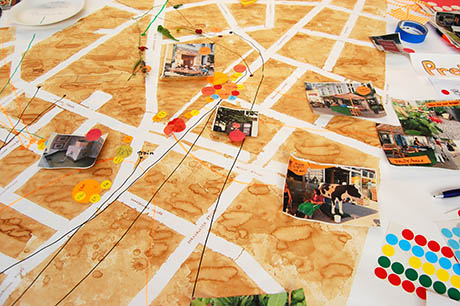
IMAGE: The completed map, with dots, lines, photos, plates, and edible evidence all overlapping. Photo by Geoff Manaugh.
Thanks to the energy, initiative, and keen eyes of the workshop participants, and despite the fact that we had only forty minutes on an extremely hot day, we nonetheless managed to gather enough information to start asking new questions and formulating new analyses about the edible landscape, as well as to begin a discussion about what we wished we had found, what we wished wasn’t there, what we’d have liked to have seen more of, and what we were surprised to find or not find.
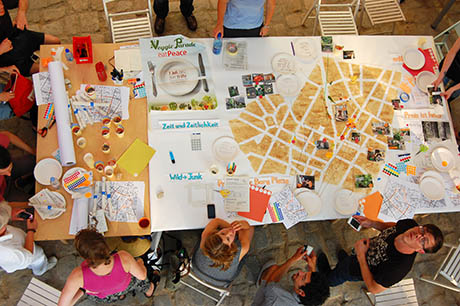
IMAGE: The workshop from above.
Although we didn’t have time for this, the next step, of course, is to share these maps: perhaps an audio tour that combines bubble tea shops with the history of East Berlin’s relationship with both Vietnam and hipster culture, or a Prenzlauer Berg twinning program that pairs dining experiences in the neighbourhood with ones in the areas where the restaurant cooks and servers actually come from…
NOTE: Thanks to everyone who attended and participated for a wonderful afternoon, to the team at the BMW Guggenheim Lab for the invitation (and especially to Sascha, Amara, and Babette for their help setting up), to Alex Toland for being such a wonderful collaborator, and to Geoff Manaugh for helping with everything, throughout.
