Inspired by Stephen Von Worley‘s wonderful The Contiguous United States Visualized by Distance to the Nearest McDonalds, doctoral astronomy student Jim Davenport decided to map “not only how Starbucks were distributed across the USA […] but how we are distributed around Starbucks.”
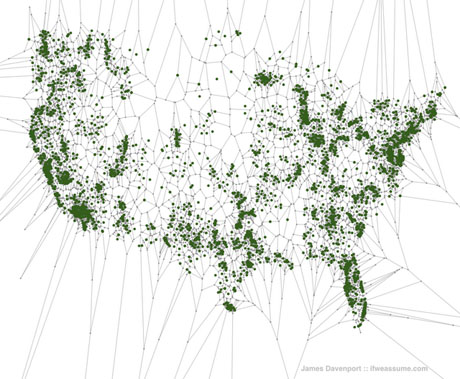
IMAGE: James Davenport’s Voronoi diagram for every Starbucks location in the United States, from his blog, If We Assume.
Using a Voronoi diagram (the same kind of map used by physician John Snow to pinpoint the Broad Street Pump as the source of the Soho cholera epidemic in 1854), Davenport discovers that the furthest possible distance from a company-owned store (i.e. not a grocery store franchise) in the contiguous United States is a mere 170 miles.
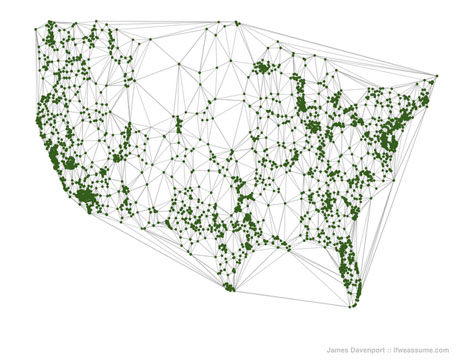
IMAGE: James Davenport’s map of the USA according to Starbucks locations, connected using a Delaunay triangulation.
Although Davenport has not laid cities or borders over the location data, it’s easy enough to identify them from the dense clusters Starbucks forms in urban areas and along major transportation corridors, such as I-95. In Florida, the North-East, the and California, the green pinpoints of Starbucks more or less map the coastline, but they reveal less about the United States-Canada border.
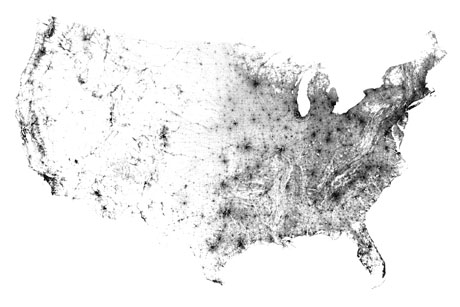
IMAGE: U.S. population density mapped by Harry Kao using 2000 Census Data. Unsurprisingly, Starbucks locations show a strong correlation with this settlement pattern.
Finally, Davenport’s analysis leads him to speculate that proximity to a Starbucks could perhaps serve as a definition for urban living, given that 82 percent of Americans live in urbanised areas and more than 80 percent of Americans also live within twenty miles of a Starbucks.
Certainly, Starbucks density is often used as a gauge of economic vitality: Davenport links to research showing that in London, “for every 0.5 km a property is located from a Starbucks, the rent falls by an average of 20 percent up to 2.5km away,” and earlier posts on Edible Geography have discussed Magic Johnson’s seemingly successful Urban Coffee Opportunities initiative to seed underserved communities with Starbucks stores as a tool of urban regeneration.
Linking the spread of Starbucks with urbanisation, or even progress, as Davenport does toward the end of his post, has obvious limitations, in addition to being a little depressing — a commenter on The Atlantic Wire, where I spotted this story, points out that decades ago, this kind of analysis might have been done to show that “no square foot of the U.S. was more than 20 miles from blacktop or a railroad.”

IMAGE: A typical Starbuck “third place” interior, via.
Nonetheless, there is something deeply interesting about the rise of the coffee shop chain over the past thirty years, both in terms of its impact on national caffeine consumption, but also in terms of the proliferation of identikit “third spaces” for people to meet, work, and relax outside their home or office. Starbucks and its competitors, alongside fast food chains and mega-retailers, really have re-made the landscape that Americans engage with every day. Mapping, as it often does, encourages us think about that in new ways.
